Monitor usage and cache health
peryx counts everything it serves, off the request path. Four surfaces show the same numbers: the dashboard, the admin
status page, the /+stats JSON endpoint, and Prometheus /metrics.
Drill down from the dashboard
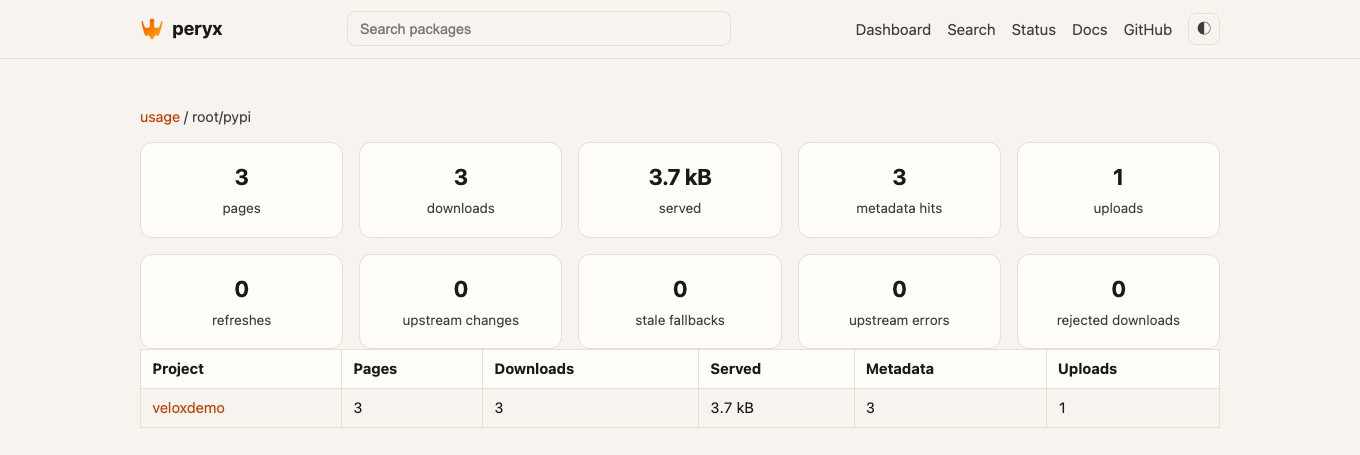
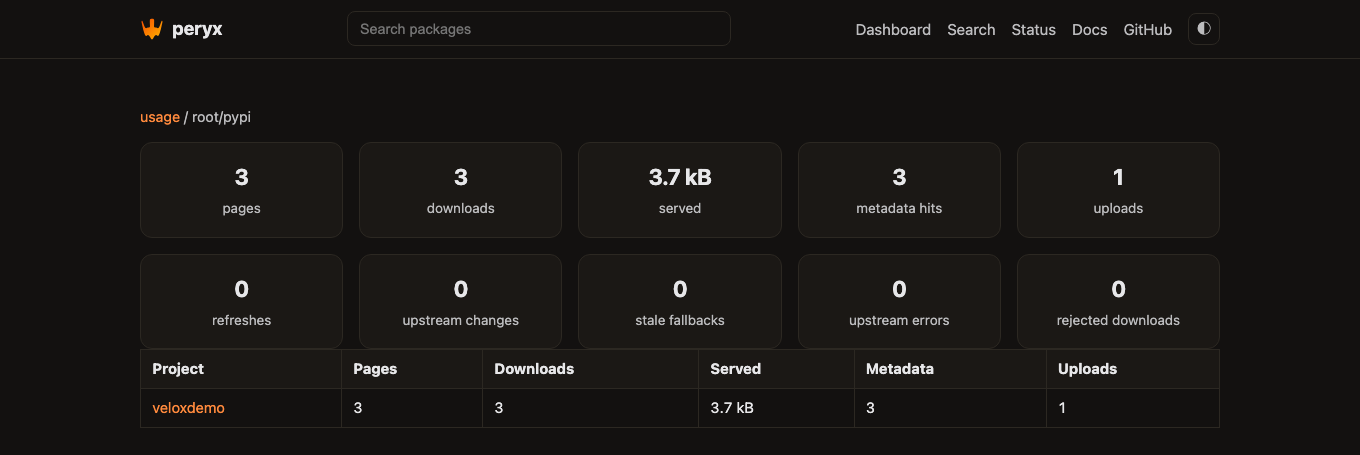
Each index card on the dashboard shows its pages, downloads, and bytes served, with a usage link. The link opens the
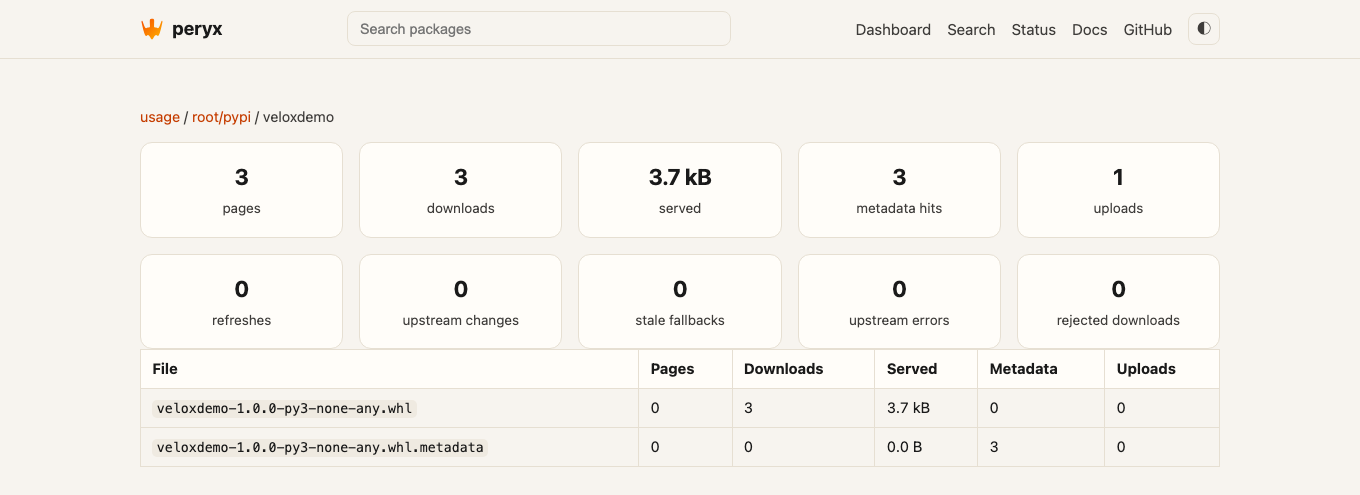
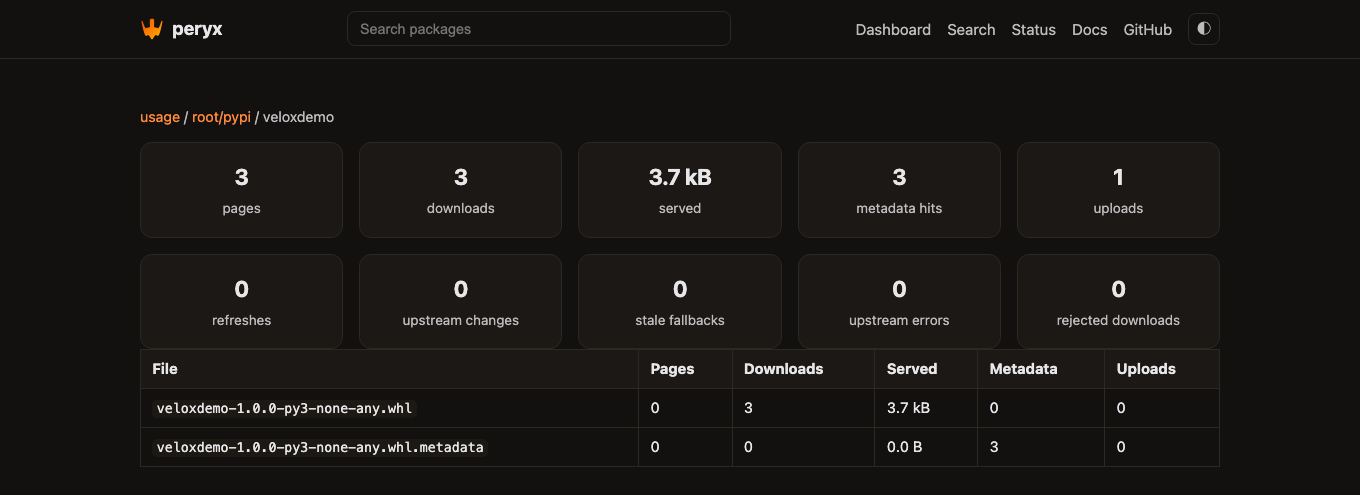
drill-down: totals for the index and a table of its projects, each project linking to its per-file counters. The same
pages live at /stats, /stats?index={route}, and /stats?index={route}&project={name}.
Query the counters
curl -s http://127.0.0.1:4433/+stats | jq
curl -s 'http://127.0.0.1:4433/+stats?index=root/pypi' | jq '.projects | to_entries | sort_by(-.value.downloads)[:5]'
curl -s 'http://127.0.0.1:4433/+stats?index=root/pypi&project=numpy' | jq .files
Counters live in memory and reset on restart; for durable time series, scrape /metrics, which exposes the same set per
index alongside the global request counter. The ecosystem label carries each index's format, so a query can split PyPI
from OCI traffic:
peryx_index_downloads_total{index="root/pypi",ecosystem="pypi",role="virtual"}
peryx_index_downloads_total{index="root/oci",ecosystem="oci",role="virtual"}
Check operational status
/admin/status combines GET /+status?details=admin with top-level GET /+stats. It shows the configured index
topology next to the same cache-health counters listed below, plus observed project counts, upload counts, recent
uploads, cached index URLs, and redacted token/authentication state. The page does not fetch upstreams or read artifacts
while it renders.
What the cache-health counters mean
| Counter | Signal |
|---|---|
refreshes | Revalidations against upstream, on demand or from the background sweep |
changed | Revalidations that found new upstream content; also logged at info |
stale_served | Pages served from cache because upstream was down; rising means an outage |
upstream_errors | Upstream failures with nothing cached to fall back to; clients saw an error |
rejected | Downloads whose bytes did not match the advertised digest; never cached |
A steady refreshes with zero changed is the normal idle state. rejected above zero deserves attention: either the
upstream served corrupt bytes or something rewrote them in transit.
Inspect the disk cache
Use the cache CLI when you need the state on disk, not request counters. It works the same for either ecosystem: the
blob store is content-addressed and shared, and --index selects a PyPI or an OCI index by route.
peryx cache size --data-dir /var/lib/peryx
peryx cache list --data-dir /var/lib/peryx --stale
peryx cache list --data-dir /var/lib/peryx --index dockerhub
peryx cache fsck --data-dir /var/lib/peryx
cache size reports cached pages, stale pages, blob files, bytes, and metadata row counts. cache list --stale lists
the stale pages with age and freshness lifetime. cache fsck validates metadata row shapes and stream-hashes blob files
against their sha256 path.
Use two steps for project purge. First print the plan, then rerun with --yes if the row counts match what you expect.
peryx cache purge project --data-dir /var/lib/peryx --index pypi --project flask
peryx cache purge project --data-dir /var/lib/peryx --index pypi --project flask --yes
peryx cache purge orphaned-blobs --data-dir /var/lib/peryx
peryx cache purge orphaned-blobs --data-dir /var/lib/peryx --yes
Project purge removes metadata rows and leaves blobs in place. Orphaned-blob purge removes blob files that no metadata row references.
Related
- Where the counters come from: architecture
- The endpoint and counter reference: HTTP endpoints
- The counters in a browser: the web UI